Dominic's Homepage!

My name is Dominic Teo and I'm currently an analytics manager with the Ministry of National Development (MND). I'm interested in the intersection of public policy and technology as well as the application of Big Data and Civic Tech in the public sphere.
I graduated Cum Laude from Sciences Po Paris with a BA in Social Sciences & Economics followed by a MS in Computational Analysis and Public Policy (MSCAPP) at the University of Chicago. The MSCAPP degree is a 2 year dual degree offered by the Schools of Computer Science and Public Policy.
Take a look at my resumé and various projects! (click on titles of projects for more details)
Hosted on GitHub Pages — Theme by orderedlist
Predicting Occurence of Violent Crime in Chicago
Project Introduction
Final Project for CAPP 30254 - Machine Learning for Public Policy. Completed by Dominic Teo, Eunjung Choi and Ya-Han Cheng.
Our project is titled “Predicting whether a violent crime is likely to occur in Chicago based on past reported crime data, socio-economic indicators and weather data”. This repository will contain both the relevant datasets that we use as well as the Jupyter Notebooks that we use to clean the data and also to create the various Machine Learning models that we use.
Datasets
There are 4 different datasets that we use but only 3 datasets can be found in our repository, under the ‘Datasets’ folder, with the 4th one being downloaded in our Jupyter Notebook and they are titled as follows:
- Reported crimes dataset (source: City of Chicago data portal): The file is too big to push into our repo. However, it can be easily downloaded at https://data.cityofchicago.org/Public-Safety/Crimes-2001-to-present/ijzp-q8t2. We utilized the 2015 data to present.
- Chicago boundaries neighbourhood dataset: “Boundaries-Neighborhoods.geojson”
- Weather dataset (source: NOAA): “2162082.csv”
Data Cleaning
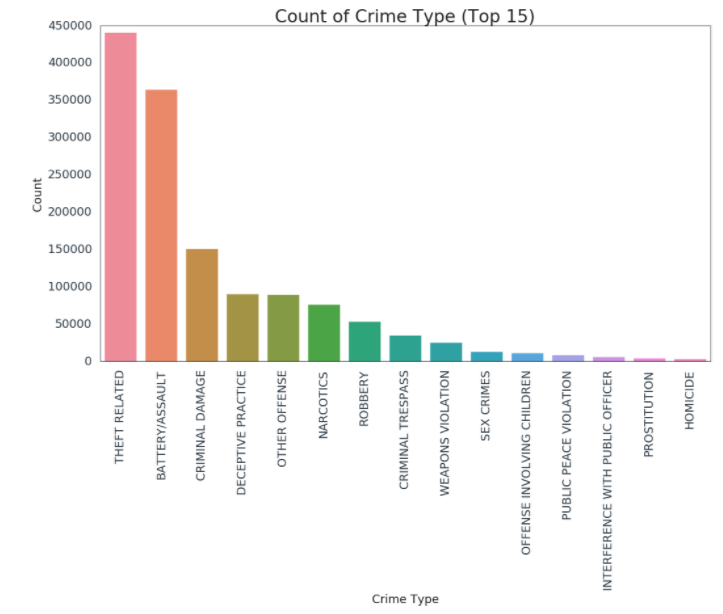
The reported crimes dataset divides the types of crimes committed to many different types. The distribution of the top 15 types of crime can be seen below.

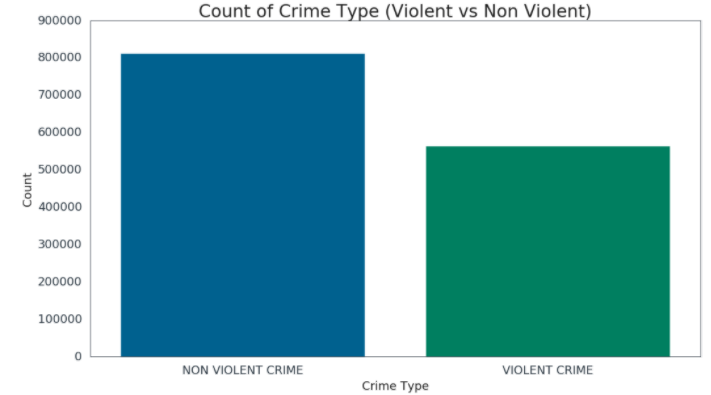
We then divided the different types of crimes into 2 types: violent and non-violent.

However, we also provided the cleaned csv files that can be used directly without having to run through the data cleaning process. The full csv (around 1.2 million rows) is unfortunately too big to be pushed to our repository so we instead created a randomly sampled csv (10% of ‘crime.csv’), titled “crime_reduced.csv”. These csv files can then be used to run the other Jupyter Notebooks meant to create and evaluate the different machine learning models.
Methodology
We will assessing 4 different models and determining which model is best suited in predicting the occurence of violent crime. The following models will be assessed:
- Decision Tree classifier
- Random Forest classifier
- Ada-Boost classifier
- Logistic Regression classifier
For each model, we train the selected model using various parameters in order to choose the parameter combination that produces the highest accuracy score. With the identified combination we refit the model, and evaluate using confusion matrix and feature importances.
For example, for our decision tree model, we run the following code for hyperparameter tuning::
tree_para = {'criterion': ['gini', 'entropy'],
             'max_depth': [3,5,7,9,11,13],
             'min_samples_split': [2,5,10]}

scorers = {'precision_score': make_scorer(precision_score),
           'recall_score': make_scorer(recall_score),
           'accuracy_score': make_scorer(accuracy_score)}

clf = GridSearchCV(DecisionTreeClassifier(random_state=0), tree_para, cv=10,
                   scoring=scorers,refit=False)

clf.fit(X_train, y_train)

cv_results_df = pd.DataFrame(clf.cv_results_)

results = cv_results_df[['param_criterion', 'param_max_depth', 'param_min_samples_split',
                         'mean_test_precision_score', 'mean_test_recall_score', 'mean_test_accuracy_score']]
We then identify the parameter combination that produces the highest accuracy score
results[results['mean_test_accuracy_score']==max(results['mean_test_accuracy_score'])]
In this case it is the following combination:
- Parameter Criteria: Gini
- Parameter Max Depth: 9
- Parameter Min Samples Split: 5
- Mean Test Precision Score: 0.58472
- Mean Test Recall Score: 0.460015
- Mean Test Accuracy Score: 0.63754
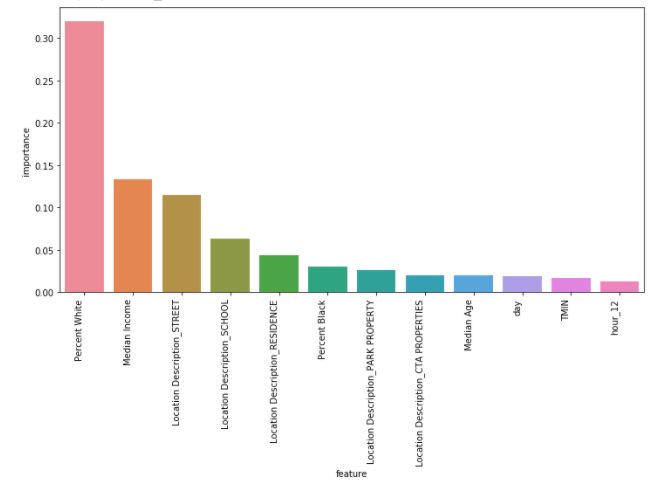
We then refit our model with the identified parameter combination and identify which features are important to the model.
dt = DecisionTreeClassifier(criterion='gini', max_depth=9, min_samples_split=5)
model = dt.fit(X_train, y_train)
fi = pd.DataFrame({'feature': list(X_train.columns),
                   'importance': model.feature_importances_}).\
                    sort_values('importance', ascending = False)
                    fig, ax = plt.subplots(figsize=(12,6))
plot = sns.barplot(x=fi.feature[:12], y=fi.importance[:12], ax=ax)
plot.set_xticklabels(plot.get_xticklabels(), rotation=90, horizontalalignment='right')

We then repeat through the process for a random forest, logistic regression and ada-boost classifier. A quick clarification on the ada-boost classifier. It is a boosting ensemble model that works especially well with decision trees. Boosting model’s key is learning from the previous mistakes, e.g. misclassification data points - AdaBoost learns from the mistakes by increasing the weight of misclassified data points.